Operational reporting for better-informed decisions
Management reporting brings selected operational records into practical summaries. Teams can use these views to understand activity and identify where follow-up may be needed.
Talk through your workflowMore than a dashboard. A reporting toolkit.
Explore 15 reporting areas: test volumes, sales, outstanding balances, outsourcing, expenses, patients, clinicians, commissions, inventory, payroll and more.
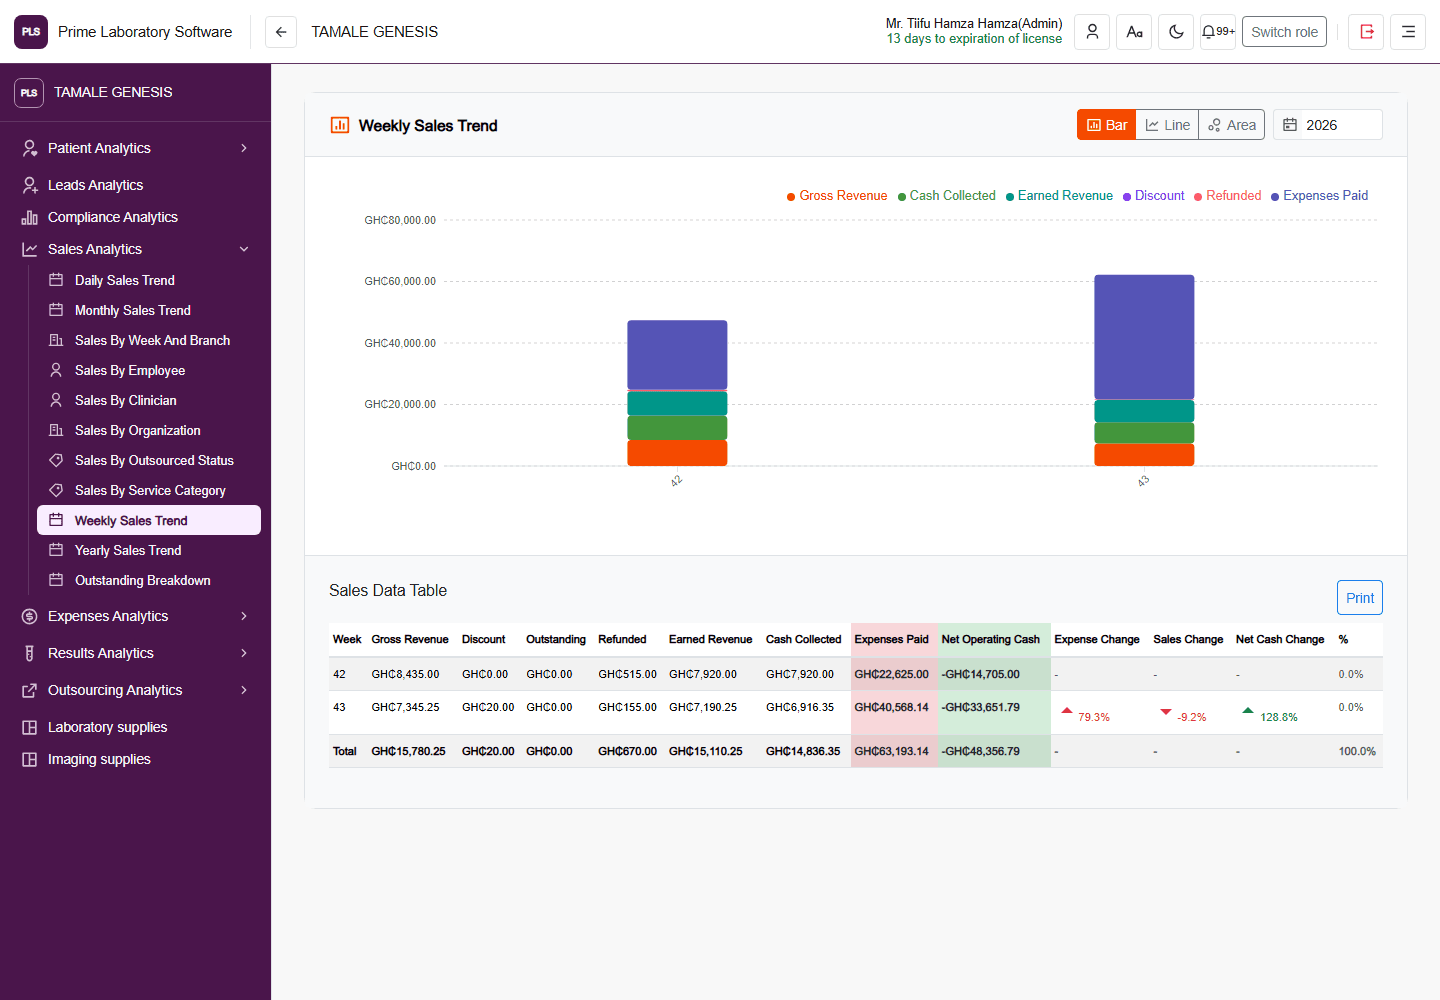
Weekly sales analytics
The actual weekly sales chart and reconciliation table, showing gross revenue, collections, earned revenue, discounts, refunds and expenses in the demo facility.
Inspect the full page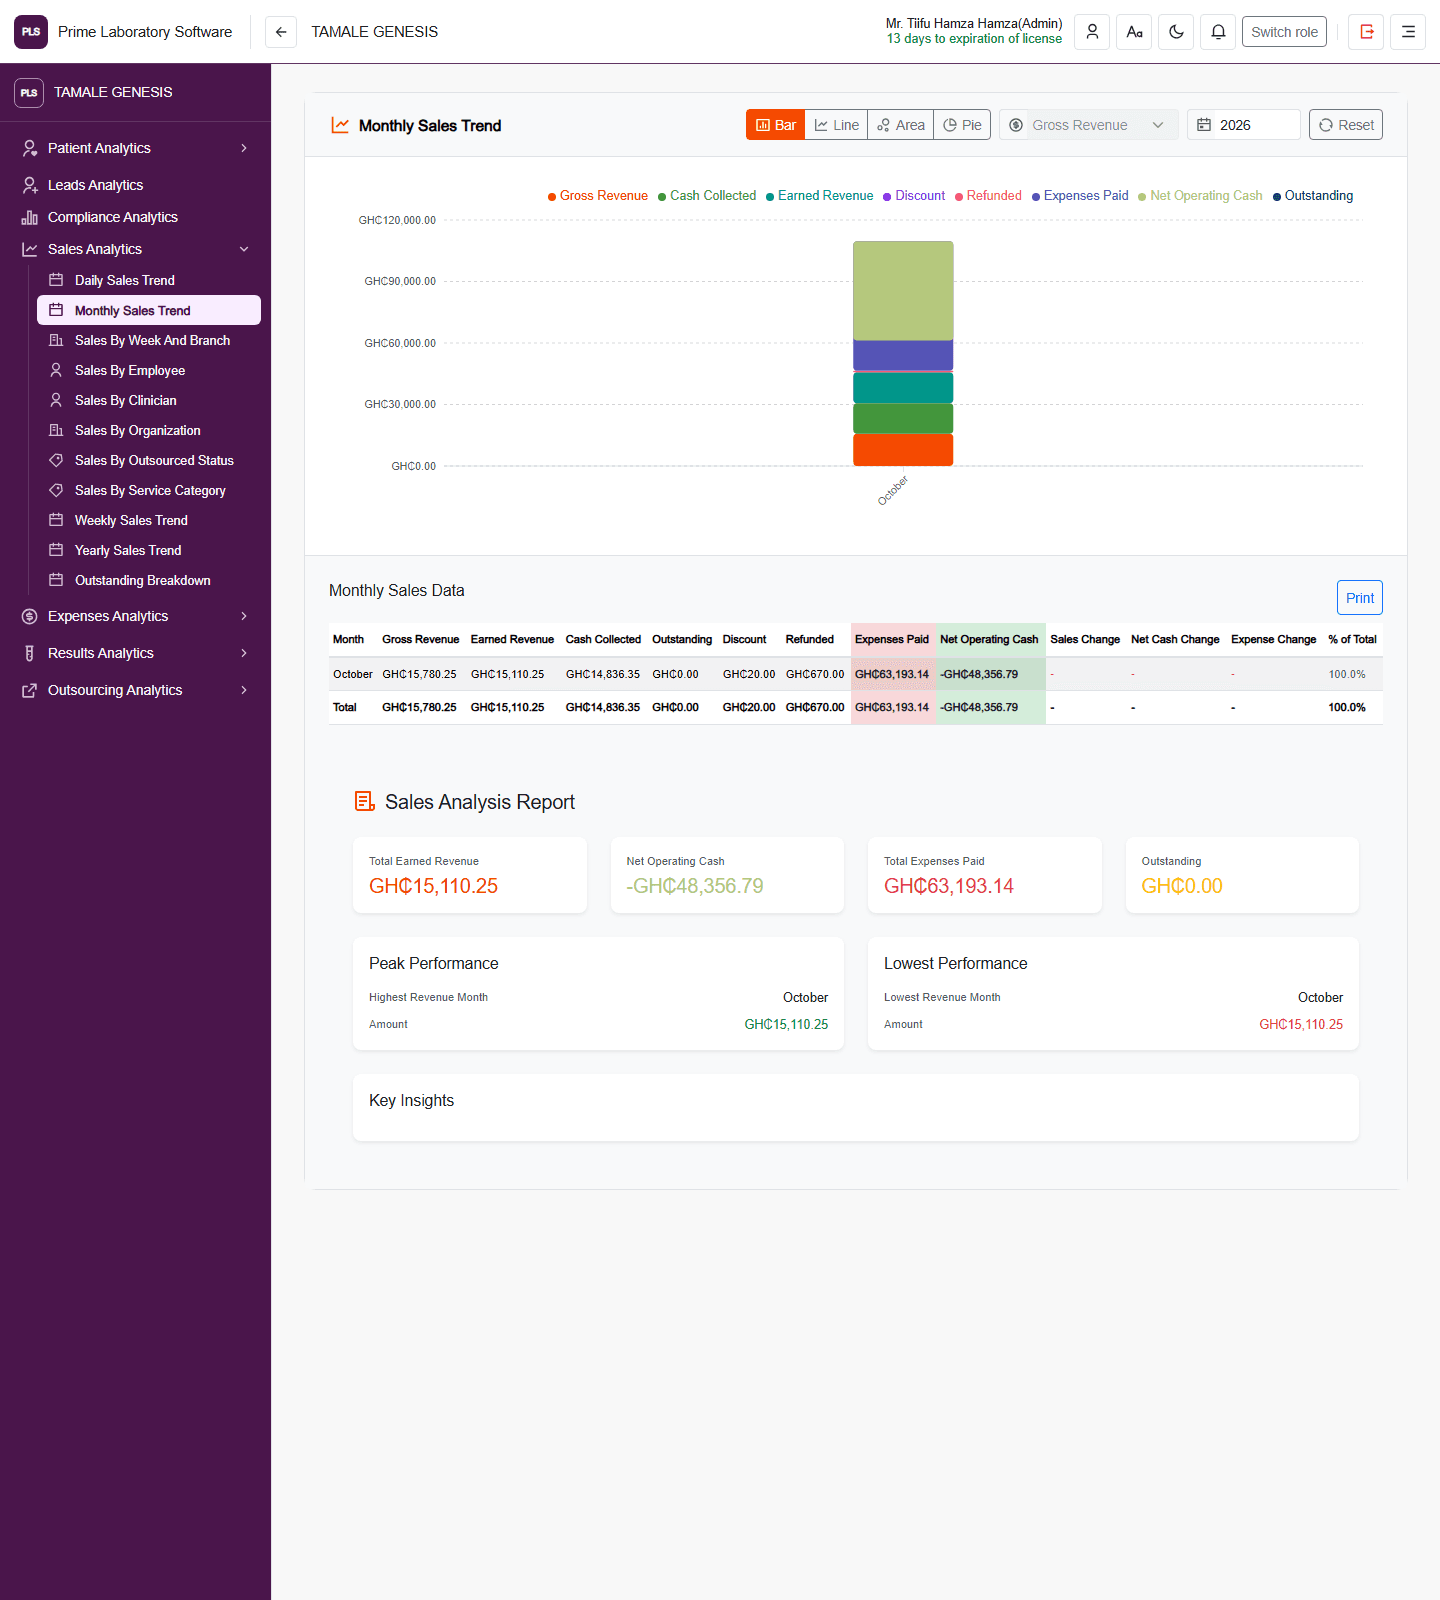
Monthly sales analytics
Monthly revenue and cash-flow charts, the sales data table and recorded performance summaries.
Inspect the full page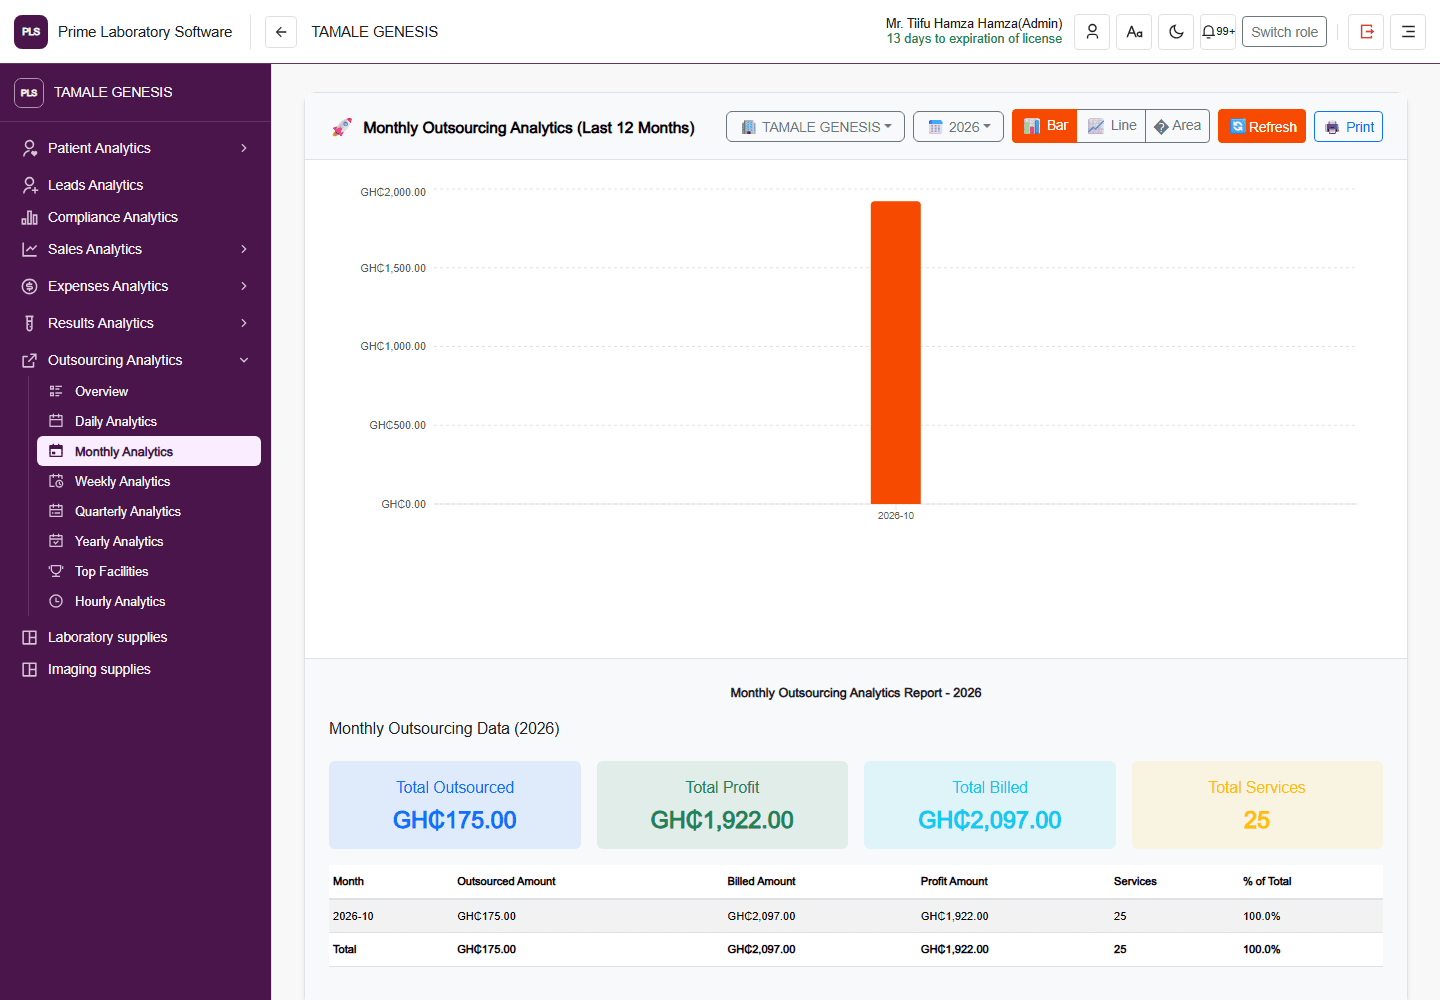
Monthly outsourcing analytics
The actual outsourcing chart and report comparing recorded outsourced costs, billed amounts, profit and service counts.
Inspect the full pageSee where this fits in your day-to-day.
Review operational workload, billing activity, outstanding balances, inventory and other configured indicators.
- ✓Operational and workload summaries
- ✓Revenue, billing and outstanding balance analysis
- ✓Inventory activity and consumption views
- ✓Audit and user activity reporting where available
Scope noteMetric definitions, date ranges and access permissions should be agreed during implementation; reported figures depend on complete source data.
Explore the supporting workflows and benefits.
Profit & Loss
The financial statement page as it appears in the demo software.
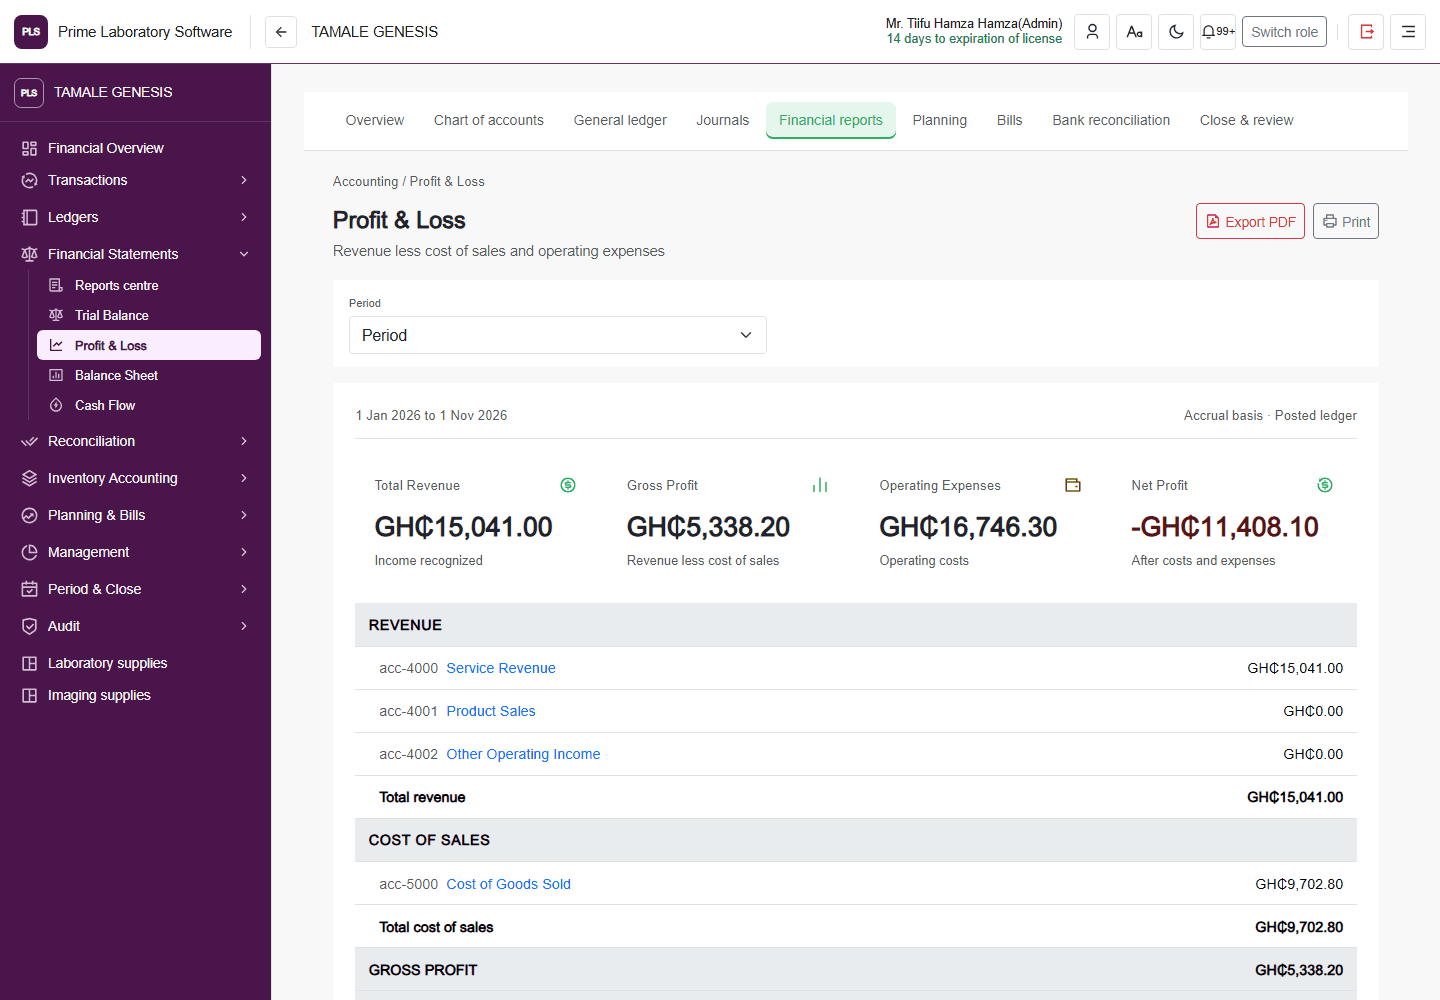
Captured from the current, customer-confirmed PLS demo facility on 1 November 2026. The application header, navigation, page content and displayed demo values are retained. This is a software page capture, not a redesigned illustration.